python colorbar自定义颜色 python可视化 matplotlib画图使用colorbar工具自定义颜色
彭伟_02 人气:3python matplotlib画图使用colorbar工具自定义颜色 colorbar(draw colorbar without any mapple/plot)
自定义colorbar可以画出任何自己想要的colorbar,自由自在、不受约束,不依赖于任何已有的图(plot/mappable)。这里使用的是mpl.colorbar.ColorbarBase类,而colorbar类必须依赖于已有的图。
参数可以参考下面的描述->matplotlib:
class matplotlib.colorbar.ColorbarBase(ax, cmap=None, norm=None, alpha=None, values=None, boundaries=None, orientation=‘vertical', ticklocation=‘auto', extend=‘neither', spacing=‘uniform', ticks=None, format=None, drawedges=False, filled=True, extendfrac=None, extendrect=False, label='')[source]
参数简单描述
- ax :可用于设置colorbar的位置、长、宽
- norm :用于规范化–设置颜色条最大最小值
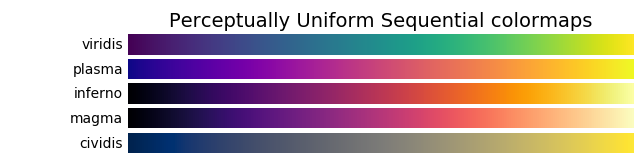
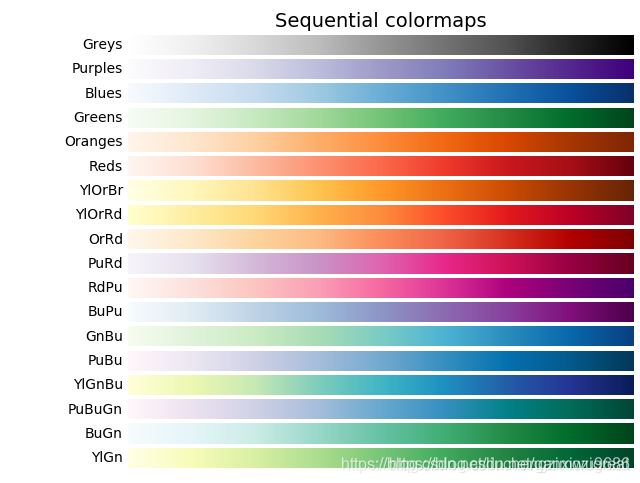
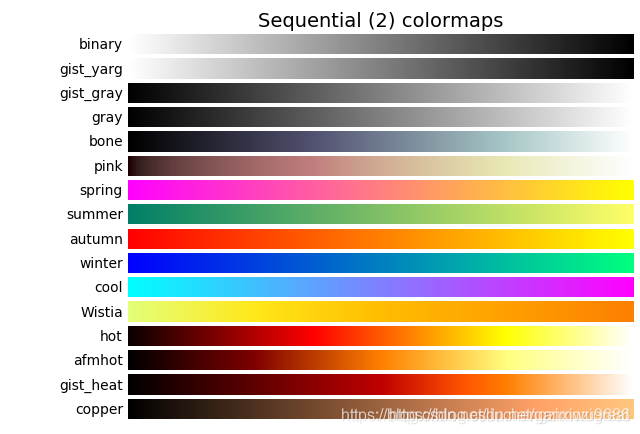
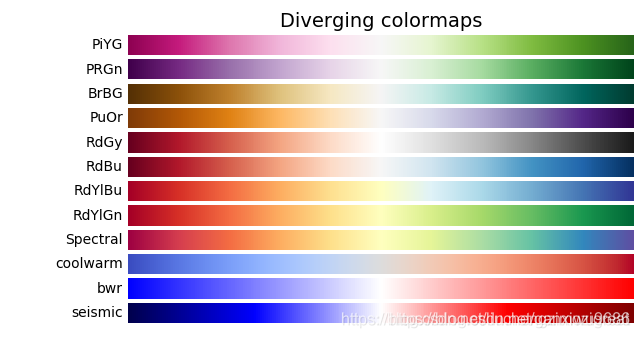
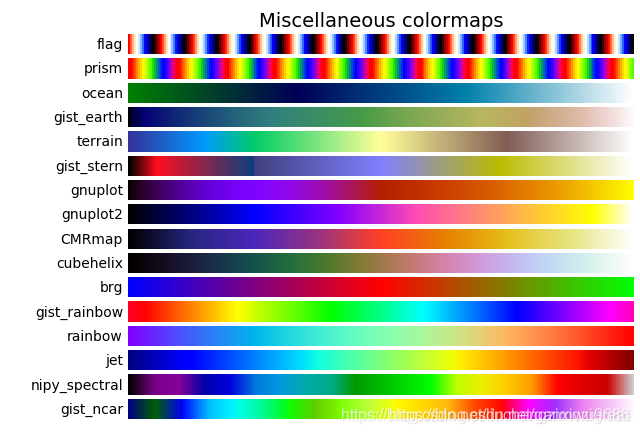
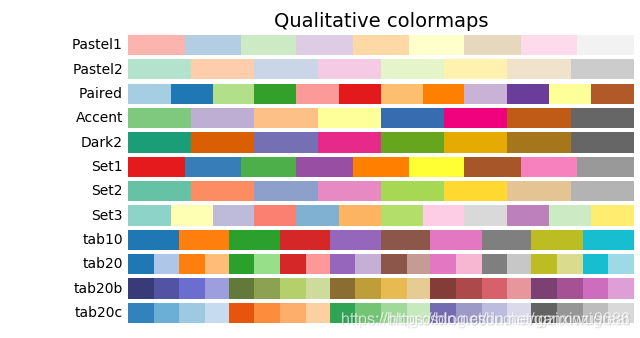
- cmap:颜色(可参考本篇博文的最后部分——推荐色带与自定义色带)
- boundaries:要想使用extend,在norm之外,必须要有两个额外的boundaries
- orientation:colorbar方向,躺平or垂直
- extend:延伸方向(在norm之外colorbar可延伸)
- ticks:自定义各段的tick(记号)给一个例子,首先定义一下横纵坐标的名称,以及df_int:
给一个例子,首先定义一下横纵坐标的名称,以及df_int:
labels_int = ['A', 'B', 'C', 'D']
variables_int = ['A', 'B', 'C', 'D']

# x_normed_int 可以是一个4*4的数组,经过归一化的
df_int = pd.DataFrame(, columns=variables_int, index=labels_int)
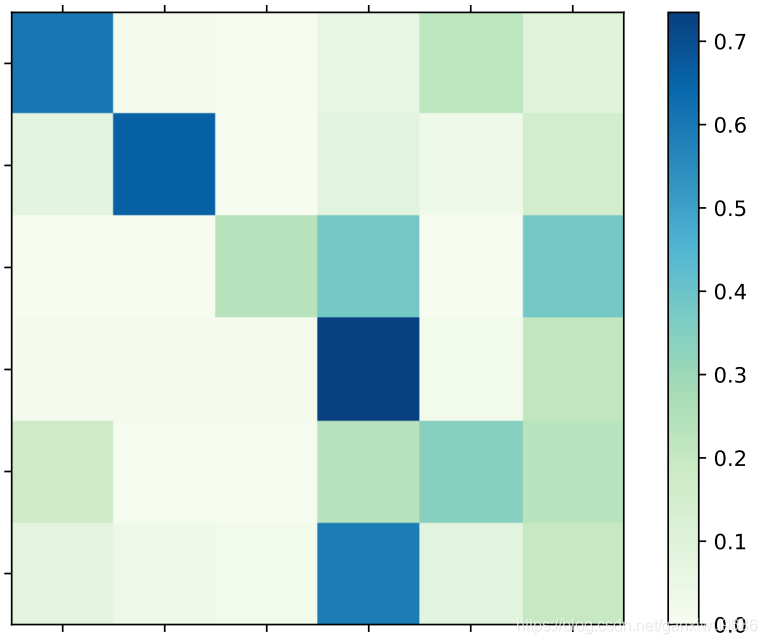
接下来就是画图了:
fig = plt.figure()
  ax = fig.add_subplot(111)
  cax = ax.matshow(df, interpolation='nearest', cmap='GnBu')
  fig.colorbar(cax)

  tick_spacing = 1
  ax.xaxis.set_major_locator(ticker.MultipleLocator(tick_spacing))
  ax.yaxis.set_major_locator(ticker.MultipleLocator(tick_spacing))

  ax.set_xticklabels([''] + list(df.columns))
  ax.set_yticklabels([''] + list(df.index))
  plt.show()
其中:
cax = ax.matshow(df, interpolation='nearest', cmap='GnBu')
可以通过cmap修改,得到不同的颜色带
最终可以看到结果如下图:
加载全部内容