Python Matplotlib动画 怎样基于Python Matplotlib实现网格动画
吃着东西不想停 人气:0—1—
如果你对本文的代码感兴趣,可以去 Github (文末提供)里查看。第一次运行的时候会报一个错误(还没找到解决办法),不过只要再运行一次就正常了。
这篇文章虽然不是篇典型的数据科学类文章,不过它涉及到数据科学以及商业智能的应用。Python 的 Matplotlib 是最常用的图表绘制以及数据可视化库。我们对折线图、柱状图以及热力图都比较熟悉,但你知道用 Matplotlib 还能做简单的动画吗?
下面就是用 Matplotlib 制作动画的例子。展示的是 John Conway 的 《The Game of Life》,这是一个 Metis(数据科学夏令营)中的编程挑战题目,同时给了我一个机会来制作我的第一个 Python 动画。看看结果的动图:

这篇文章的重点还是主要放在 python 中如何用 Matploylib 制作动画。
但如果你不太熟悉模拟游戏的话(它更像是可以看的模拟动画,而非可以玩的游戏),我来给大家介绍一下规则:
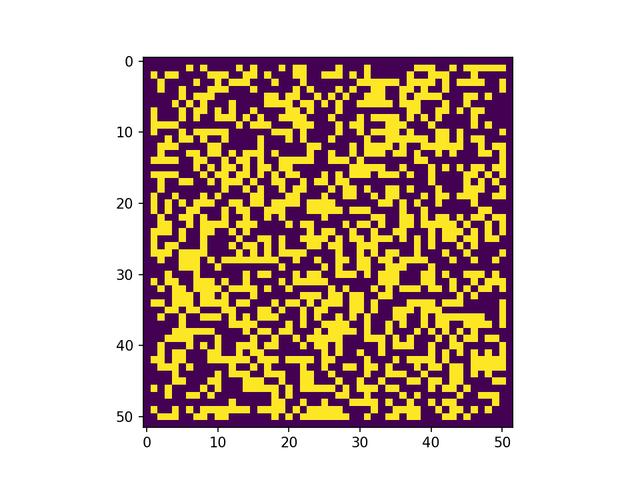
- 一开始先设置一个 N×N 的网格(我的动画中用的是 50×50 );
- 接着随机地向格子中填充“小细胞”(一开始随机地从 2500 个格子中选取 1500 个进行填充);
- 如果邻居小细胞少于等于 1 个,那格子中的小细胞会死掉;
- 如果邻居大于等于 4 个的也会死掉;
- 只有 2 个或 3 个邻居时可以生存;
- 空的格子中如果正好有 3 个邻居,则会长出 1 个新的“小细胞”;
—2—
建立网格
我们首先导入所需的库。
import time
from IPython import display
import matplotlib.pyplot as plt
import matplotlib.animation as animation
我们会利用Matploylib 动画模块中的 FuncAnimation() 函数。 FuncAnimation()是通过多次调用一个函数并逐次更新图片来实现让图片动起来的。我们来一步步地实现这个过程。
但首先,我们需要先初始化我们的网格。下面的几行代码用来存储我们输入的数据:
- 我们需要一个 50×50 大小的网格;
- pad 变量可以使得计算邻居变得更容易。通过在边界外添加一层空白格子,我们就不需要额外再写一个逻辑来处理网格的边界。因此我们 50×50 的网格其实是被一圈空白格子包围着,这使得实际的 numpy 序列的大小为 52×52;
- initial_cels 变量表示在网格启动的时候我们想要多少“小细胞”。他们会被随机地分布在网格上。
# Input variables for the board
boardsize = 50    # board will be X by X where X = boardsize
pad = 2        # padded border, do not change this!
initial_cells = 1500 # this number of initial cells will be placed
           # in randomly generated positions
接下来我们随机地生成一系列“小细胞”的初始坐标(上面我们选择了 1500 个)。把这些坐标存储在 pos_list 变量中。
# Get a list of random coordinates so that we can initialize
# board with randomly placed organisms
pos_list = []
for i in range(initial_cells):
  pos_list.append([random.randint(1, boardsize),
           random.randint(1, boardsize)])
然后我们是时候该初始化网格了。我们会用一组叫 my_board 的 numpy 序列来代表我们的网格——我们先生成一个 52×52 数值为 0 的矩阵序列作为开始(比 50×50 大是由于增加了空白边缘),然后调用 init_board() 函数来根据 pos_list 中的坐标把“小细胞”填充到网格中。辅助函数的具体细节我不再展开讲了,不过我把他们都整理到我的 Github 上了。
# Initialize the board
my_board = np.zeros((boardsize+pad, boardsize+pad))
my_board = init_board(pos_list, my_board)
—3—
制作网格动画
这是我们最期待的部分——动画!首先,我们需要完善一些配置。下面的几行代码用来生成展示我们动画的 mtplotlib 图框。
# Required line for plotting the animation
%matplotlib notebook
# Initialize the plot of the board that will be used for animation
fig = plt.gcf()
接下来制作我们的第一帧。 mtplotlib 中的 imshow() 函数可以接收一组 numpy 矩阵然后返回一张图片。很酷吧!
# Show first image - which is the initial board
im = plt.imshow(my_board)
plt.show()
传入 imshow() 的变量是我们的初始的网格 my_board。生成的图片长这样:
现在我们需要写一个可以给 FuncAnimation() 调用的辅助函数。 animate() 函数接受一帧画面作为输入充当计数器。这个画面计数器就是 FuncAnimation() 和 animate() 函数沟通的桥梁——在每一个时间点(也就是每一帧),它都会调用一次 animate()。然后 animate() 会逐次使用辅助函数 update_board() 来对网格进行迭代。最后, set_data() 函数将图片更新为迭代后的网格,这就完成了。
# Helper function that updates the board and returns a new image of
# the updated board animate is the function that FuncAnimation calls
def animate(frame):
  im.set_data(update_board(my_board))
  return im,
一切顺利!我们准备调用 FuncAnimation() 函数了。注意输入的参数:
- fig 是我们在前面创建的用来装载我们的动画的图形变量;
- animate 是 FuncAnimation() 用画面计数器进行沟通的函数(自动传入,不需要特别声明)
- frames 表示我们希望动画持续多少帧,在这里我们想要动画的长度为 200 帧;
- interval 表示每一帧之间间隔的毫秒数。我们想要每帧之间间隔 50 毫秒。
# This line creates the animation
anim = animation.FuncAnimation(fig, animate, frames=200,
                interval=50)
就这么简单!不是很难吧?为了庆祝我们成功制作动画,我再送大家一个动画:

—4—
总结
希望这篇文章能帮到大家。在结束之前,让我来帮助大家脑补更多我们今天学到的动画功能在数据科学上的应用:
- 一个个地画出蒙特卡洛模拟数据,你能观察到最终的分布是如何逐步形成的;
- 按顺序遍历时间序列数据,可以描绘你的模型或数据在新的观察角度下有什么表现;
- 当你改变输入参数时,比如族群数,可以展现你的算法是如何划分族群的;
- 根据时间或不同的数据子集生成关联热力图,用于观察不同的样本是如何影响你的模型的预期参数的。
加载全部内容