python的scipy实现插值的代码实例
人气:0插值对于一些时间序列的问题可能比较有用。
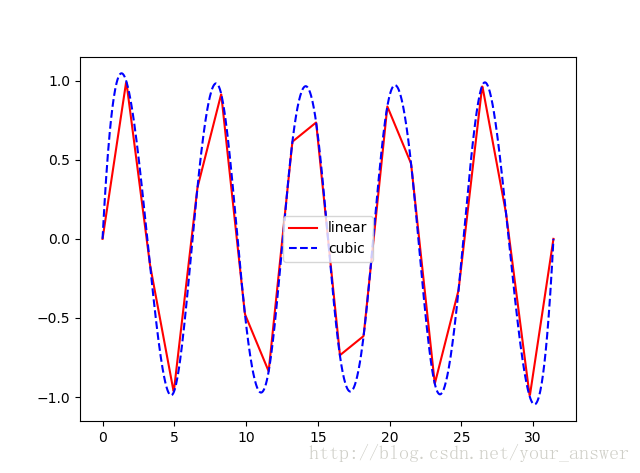
Show the code directly:
import numpy as np
from matplotlib import pyplot as plt
from scipy.interpolate import interp1d

x=np.linspace(0,10*np.pi,num=20)
y=np.sin(x)
f1=interp1d(x,y,kind='linear')#线性插值
f2=interp1d(x,y,kind='cubic')#三次样条插值
x_pred=np.linspace(0,10*np.pi,num=1000)
y1=f1(x_pred)
y2=f2(x_pred)
plt.plot(x_pred,y1,'r',label='linear')
plt.plot(x_pred,y2,'b--',label='cubic')
plt.legend()
plt.show()
官网上有更详细的参数使用:https://docs.scipy.org/doc/scipy-0.14.0/reference/generated/scipy.interpolate.interp1d.html
您可能感兴趣的文章:
加载全部内容