R语言绘制Vonoroi图 R语言绘制Vonoroi图的完整代码
作图帮 人气:0想了解R语言绘制Vonoroi图的完整代码的相关内容吗,作图帮在本文为您仔细讲解R语言绘制Vonoroi图的相关知识和一些Code实例,欢迎阅读和指正,我们先划重点:R语言绘制Vonoroi图,R语言Vonoroi图,下面大家一起来学习吧。
deldir包绘制Voronoi图
#install.packages("deldir")
library(deldir)

# data
set.seed(1)
x <- runif(60)
y <- runif(60)

# Calculate Voronoi Tesselation and tiles
tesselation <- deldir(x, y)
tiles <- tile.list(tesselation)

plot(tiles, pch = 19,
     border = "black", #边界颜色
     showpoints = TRUE, #是否显示点
     fillcol = hcl.colors(60, "Sunset"))  #填充颜色

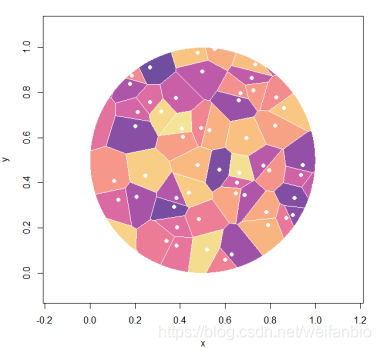
#改变图形的形状
#install.packages("polyclip")
library(polyclip)
# Circle环状
s <- seq(0, 2 * pi, length.out = 3000)
circle <- list(x = 0.5 * (1 + cos(s)),
               y = 0.5 * (1 + sin(s)))
plot(tiles, pch = 19,
     col.pts = "white",
     border = "black",
     fillcol = hcl.colors(60, "Sunset""),
     clipp = circle)
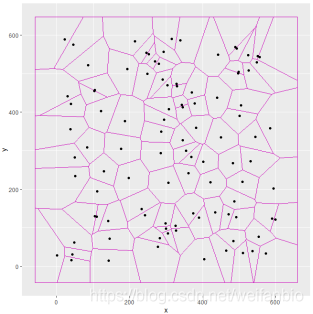
ggplot2绘制Voronoi图
library(ggvoronoi)
library(ggplot2)

set.seed(1)
x <- sample(1:600, size = 100)
y <- sample(1:600, size = 100)
dist <- sqrt((x - 200) ^ 2 + (y - 200) ^ 2)

df <- data.frame(x, y, dist = dist)

ggplot(df, aes(x, y)) +
  stat_voronoi(geom = "path",
               color = 6,
               lwd = 0.7,
               linetype = 1)
  geom_point()
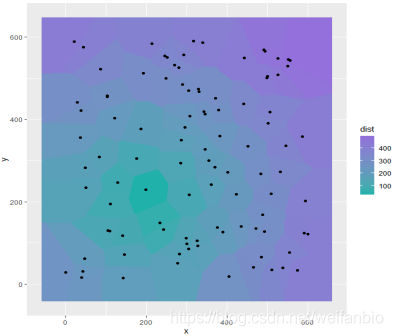
#添加热图
ggplot(df, aes(x, y, fill = dist)) +
  geom_voronoi() +
  geom_point() +
  scale_fill_gradient(low = "#20B2AA",
                      high = "#9370DB") #颜色
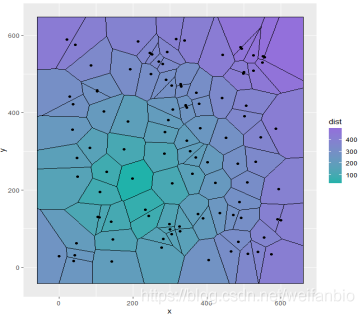
#添加边界线
ggplot(df, aes(x, y, fill = dist)) +
  geom_voronoi() +
  stat_voronoi(geom = "path") +
  geom_point()+
  scale_fill_gradient(low = "#20B2AA",
                      high = "#9370DB")
 #theme(legend.position = "none") # 去掉右侧图例标签
加载全部内容