dotnet monitor讲解
晓晨Master 人气:0一.什么是 dotnet monitor
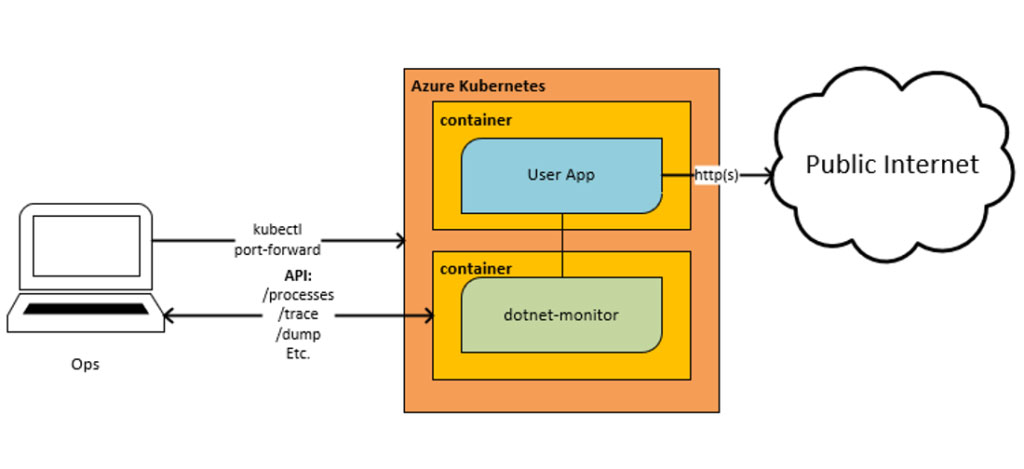
在不同的环境中运行 .NET 应用程序可能会使收集诊断信息(例如日志、跟踪、dump)变得困难。dotnet monitor 是一种工具,它提供了一种统一的方法来收集这些诊断信息,而不管您是在桌面计算机(desktop machine 可理解为我们日常使用的电脑)还是在 kubernetes 集群中运行。
收集这些诊断信息有两种不同的机制:
- 按需收集诊断信息的
HTTP API。当您的应用程序遇到问题并且想收集更多信息时,可以调用这些 HTTP API。 - 基于规则配置的
触发器。您可以配置规则,以便在满足所需条件时收集诊断信息,例如在 CPU 持续一段时间保持较高的指标时收集进程转储(process dump)。
二.入门
dotnet monitor 可以通过两种不同的分发机制获得:
- .NET CLI 工具
- 通过 Microsoft Container Registry (MCR) 获得的容器镜像
.NET CLI 工具
dotnet monitor CLI 工具首先需要安装 .NET 6 SDK,如果你没有足够新的 SDK,可以通过 .NET 下载网页获取安装包进行安装。
你可以使用一下命令获取最新版的 dotnet monitor:
dotnet tool install -g dotnet-monitor --version 6.0.0
如果你已经安装但是想更新到最新,可以运行以下命令:
dotnet tool update -g dotnet-monitor --version 6.0.0
容器镜像
dotnet monitor 容器镜像在 MCR 上可用,你可以通过以下命令获取最新的镜像:
docker pull mcr.microsoft.com/dotnet/monitor:6.0.0
三.HTTP API
dotnet monitor 公开了一个 HTTP API 来查询可用进程、收集诊断信息并检查请求信息的状态。
暴露了以下 HTTP API:
/processes- 获取可被发现的进程的详细信息/dump- 在不使用调试器的情况下捕获进程的 dump/gcdump- 捕获进程的 GC dump/trace- 不使用 profiler 来追踪进程/metrics- 以 Prometheus exposition 格式捕获默认进程的指标快照/livemetrics- 捕获进程的实时指标流/logs- 捕获进程的日志/info- 获取有关 dotnet monitor 的信息/operations- 获取操作状态和取消操作
下面的示例演示如何使用 dotnet monitor 从目标进程开始,在60秒的时间内从Microsoft.AspNetCore.Server.Kestrel.Connections 日志级别为 Debug 的日志流数据。
PS> curl.exe -X POST "https://localhost:52323/logs?name=myWebApp&durationSeconds=60" `
    -H "Accept: application/x-ndjson" `
    -H "Content-Type: application/json" `
    --negotiate -u $(whoami)`
    -d '{"filterSpecs": {"Microsoft.AspNetCore.Server.Kestrel.Connections": "Debug"}}'

{"Timestamp":"2021-11-05 08:12:54Z","LogLevel":"Debug","EventId":39,"EventName":"ConnectionAccepted","Category":"Microsoft.AspNetCore.Server.Kestrel.Connections","Message":"Connection id u00220HMD06BUKL2CUu0022 accepted.","State":{"Message":"Connection id u00220HMD06BUKL2CUu0022 accepted.","ConnectionId":"0HMD06BUKL2CU","{OriginalFormat}":"Connection id u0022{ConnectionId}u0022 accepted."}}
{"Timestamp":"2021-11-05 08:12:54Z","LogLevel":"Debug","EventId":1,"EventName":"ConnectionStart","Category":"Microsoft.AspNetCore.Server.Kestrel.Connections","Message":"Connection id u00220HMD06BUKL2CUu0022 started.","State":{"Message":"Connection id u00220HMD06BUKL2CUu0022 started.","ConnectionId":"0HMD06BUKL2CU","{OriginalFormat}":"Connection id u0022{ConnectionId}u0022 started."}}
{"Timestamp":"2021-11-05 08:12:54Z","LogLevel":"Debug","EventId":9,"EventName":"ConnectionKeepAlive","Category":"Microsoft.AspNetCore.Server.Kestrel.Connections","Message":"Connection id u00220HMD06BUKL2CUu0022 completed keep alive response.","State":{"Message":"Connection id u00220HMD06BUKL2CUu0022 completed keep alive response.","ConnectionId":"0HMD06BUKL2CU","{OriginalFormat}":"Connection id u0022{ConnectionId}u0022 completed keep alive response."},"Scopes":[{"ConnectionId":"0HMD06BUKL2CU"},{"RequestId":"0HMD06BUKL2CU:00000002","RequestPath":"/"}]}
如上面的示例所示,您可以使用 dotnet monitor 按需从目标进程中捕获诊断信息。除了日志,您还可以从目标进程收集跟踪、内存转储、GC转储和 metrics。
四.触发器
dotnet monitor 可以配置为根据发现的进程中的条件自动收集诊断信息。 发现新进程时,如果该进程数据与规则匹配,则 dotnet monitor 将尝试应用配置的规则。 应用的规则将开始监视触发器描述的条件的过程。 如果满足该条件,则假定尚未达到指定的限制来执行操作列表。
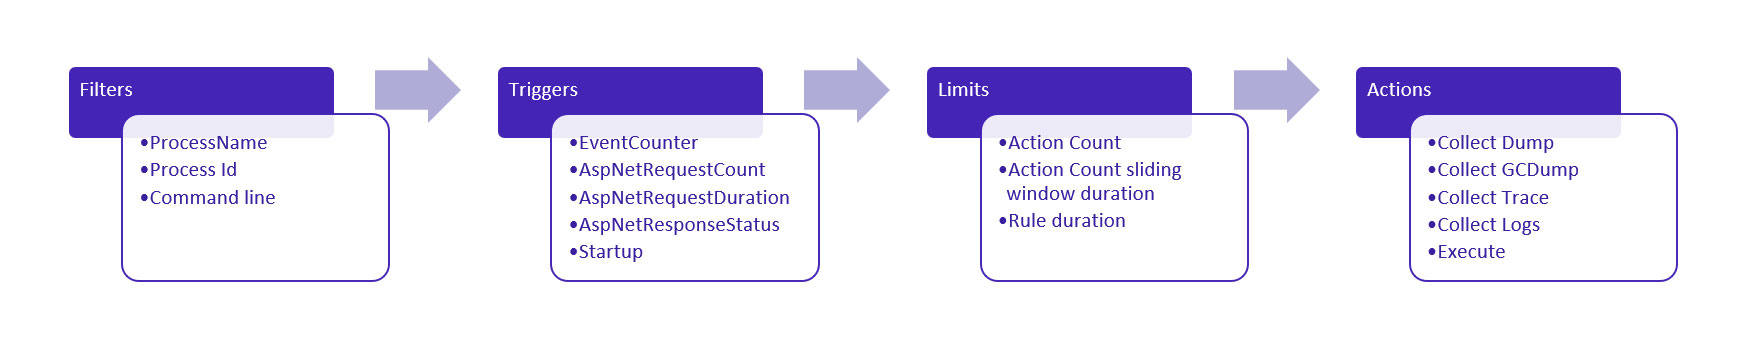
示例:如果 dotnet monitor 检测到持续超过一分钟的CPU使用率在80%以上,则它将收集进程 dump,限制每小时不超过1个。
{
  "CollectionRules": {
    "HighCpuRule": {
      "Filters": [
        {
          "Key": "ProcessName",
          "Value": "MyApp",
          "MatchType": "Exact"
        }
      ],
      "Trigger": {
        "Type": "EventCounter",
        "Settings": {
          "ProviderName": "System.Runtime",
          "CounterName": "cpu-usage",
          "GreaterThan": 80,
          "SlidingWindowDuration": "00:01:00"
        }
      },
      "Limits": {
        "ActionCount": 1,
        "ActionCountSlidingWindowDuration": "1:00:00"
      },
      "Actions": [
        {
          "Type": "CollectDump",
          "Settings": {
            "Type": "Triage",
            "Egress": "myBlobStorageAccount"
          }
        }
      ]
    }
  }
}
规则文档:https://github.com/dotnet/dotnet-monitor/blob/main/documentation/collectionrules.md
五.反馈
github issue: https://github.com/dotnet/dotnet-monitor/issues/new/choose
加载全部内容