SpringBoot监控SQL
剑圣无痕 人气:3前言
监控SQL是现在项目运维中必要的一部分,通过SQL监控我们能够明显的分析系统那些地方存在问题,从而有效的进行SQL优化,提升系统的性能。那么常见的SQL监控方式又那些呢?

MYSQL监控慢SQL
MySLQ如果需要监控慢SQL,需要在/ect/my.cnf文件中进行如下配置:
slow_query_log = ON
slow_query_log_file = /data/mysql/slow.log
long_query_time = 2
- slow_query_log:打开慢SQL日志
- slow_query_log_file:输出慢SQL文件的路径
- long_query_time : 定义SQl时间为多久为慢SQL
输出结果
select userid from t_user;
# Time: 2022-04-16T20:40:30.411674Z
# Query_time: 90.438767 Lock_time: 0.000000 Rows_sent: 43 Rows_examined: 25360591
输出SQL的查询时间、锁定时间、影响的行数等。
Druid监控慢SQL
Spring Boot默认使用的数据库连接池为HikariCP,但是Druid连接池为阿里巴巴开发的,提供强大的监控和扩展功能,如果项目中使用Druid连接池而没有开启SQL监控,那么对于项目来说就是一种浪费,那么Spring Boot Druid如何监控SQL呢?
添加Druid依赖
<dependency>
        <groupId>org.springframework.boot</groupId>
        <artifactId>spring-boot-starter-jdbc</artifactId>
      </dependency>

	 <dependency>
			<groupId>mysql</groupId>
			<artifactId>mysql-connector-java</artifactId>
			<scope>runtime</scope>
		</dependency>

      <!--druid -->
		<dependency>
			<groupId>com.alibaba</groupId>
			<artifactId>druid-spring-boot-starter</artifactId>
			<version>${druid.version}</version>
		</dependency>
Yml文件中配置Druid属性
spring:
  messages:
    encoding: UTF-8
    baseName: i18n/messages
    fallbackToSystemLocale: false
  datasource:
    druid:
      driver-class-name: com.mysql.cj.jdbc.Driver
      url: jdbc:mysql://localhost:3306/test?allowMultiQueries=true&characterEncoding=utf8&serverTimezone=Hongkong&useSSL=true&nullNamePatternMatchesAll=true&autoReconnect=true
      username: xx
      password: yy
      #初始连接池值
      initial-size: 10
      //最大连接数
      max-active: 100
      //最小连接数
      min-idle: 10
      #连接等待时间
      max-wait: 60000
      #
      pool-prepared-statements: true
      max-pool-prepared-statement-per-connection-size: 20
      time-between-eviction-runs-millis: 60000
      min-evictable-idle-time-millis: 300000
      validation-query: SELECT 1 FROM DUAL
      test-while-idle: true
      test-on-borrow: false
      test-on-return: false
      #配置StatViewServlet监控页面
      stat-view-servlet:
            #开启
            enabled: true
            #访问监控路径的地址
            url-pattern: /druid/*
            #不允许清空,重新统计
            reset-enable: false
            #登录用户名
            login-username: admin
            #登录密码
            login-password: admin
            #允许访问地址
            allow: 127.0.0.1
      ########## 配置WebStatFilter,用于采集web关联监控的数据 #########
      web-stat-filter:
        #启动statFilter
        enabled: true
        #排除的url
        exclusions: /druid/*,*.js,*.gif,*.jpg,*.bmp,*.png,*.css,*.ico
        #开启session统计
        session-stat-enable: true
        #session的最大个数,默认为100
        session-stat-max-count: 1000
        #过滤的url
        url-pattern: /*
      filter:
           stat:
             #开启慢sql统计
             log-slow-sql: true
             #慢sql的时间
             slow-sql-millis: 2000
             merge-sql: true
             #开启druid datasource监控
             enabled: true
           wall:
             config:
             multi-statement-allow: true
监控页面
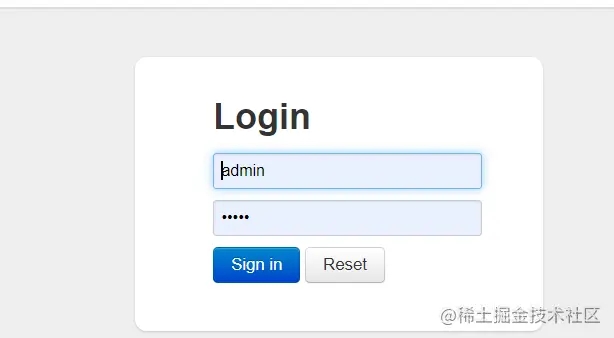
1.启动项目,访问http://ip:port/druid, 进入登录页面,输入用户名和密码登录
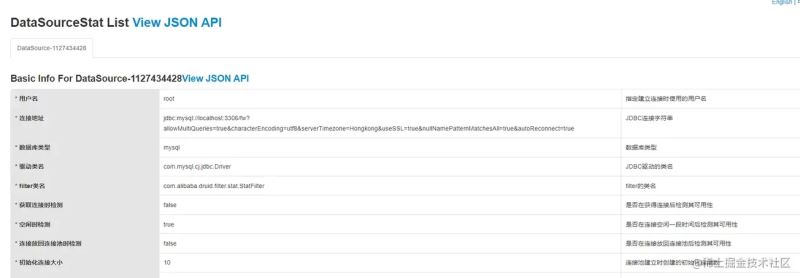
2.数据源页面,该页面配置的是当前dataSource的相关信息
3.SQL监控页面
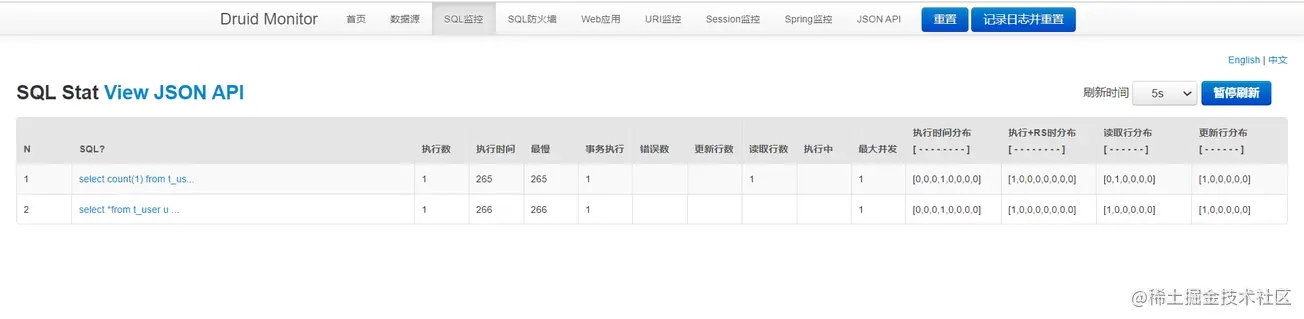
此页面会展示所有执行sql的语句,包含SQL执行次数、执行的时间、事务执行次数、最慢执行时间等信息
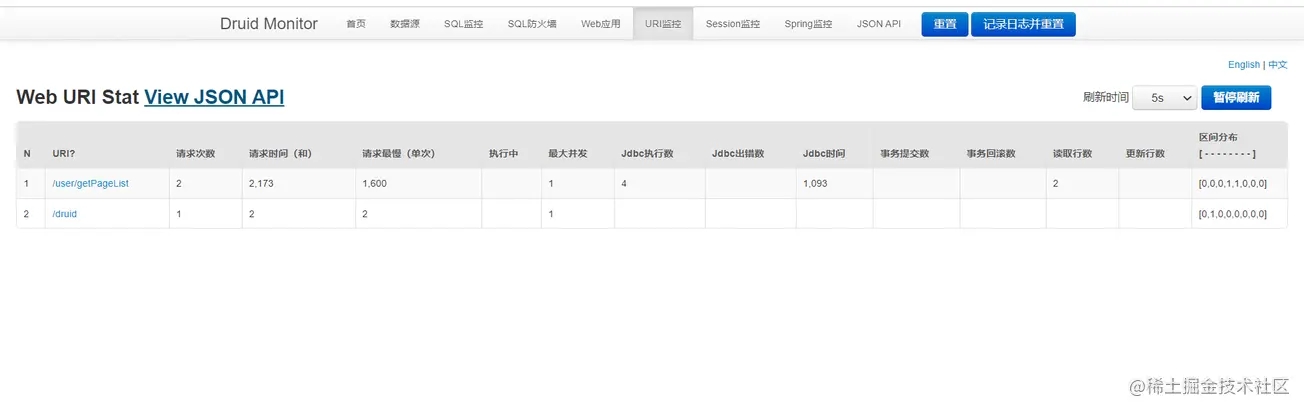
4.URI监控,统计了所有Controller接口的访问以及执行情况
5.去除相关的广告
访问监控页面的时候,你可能会在页面底部(footer)看到阿里巴巴的广告 原因:引入的druid的jar包中的common.js(里面有一段js代码是给页面的footer追加广告的) 去除的方案有两种
5.1 直接注释源码中的的相关代码
找到 druid-1.19 jar包 在common.j中直接注释如下代码即可
// this.buildFooter();
5.2 自定义过滤来去除广告
@WebFilter(urlPatterns = "/druid/js/common.js")
public class RemoveDruidAdvertFilter implements Filter
{
    @Override
    public void doFilter(ServletRequest request, ServletResponse response,
            FilterChain chain) throws IOException, ServletException
    {
        String text = Utils.readFromResource("support/http/resources/js/common.js");
        text = text.replace("this.buildFooter();", "");
        response.getWriter().write(text);
    }
}
注意需要在中添加相关的过滤器
@SpringBootApplication
@ServletComponentScan("com.skywares.fw.common.filter")//配置过滤器的地址
public class FwCoreApplication
{
    public static void main(String[] args)
    {
        SpringApplication.run(FwCoreApplication.class, args);
    }
}
特殊说明
目前Driud监控SQL功能只能针对单数据库的情况,对于多数据源的场景无法满足。
Prometheus+grafana实现SQL监控
Prometheus+grafana实现SQL监控方案比较复杂,本文中就不详细讲解了,在后续的性能优化专栏中会重点讲解。
结尾
SQL监控是项目中比较重要的一环,本文从几个方法来讲解如何监控SQL,如果项目中还没使用此功能,那么赶紧去开启吧。
加载全部内容