vue Echart立体柱状图
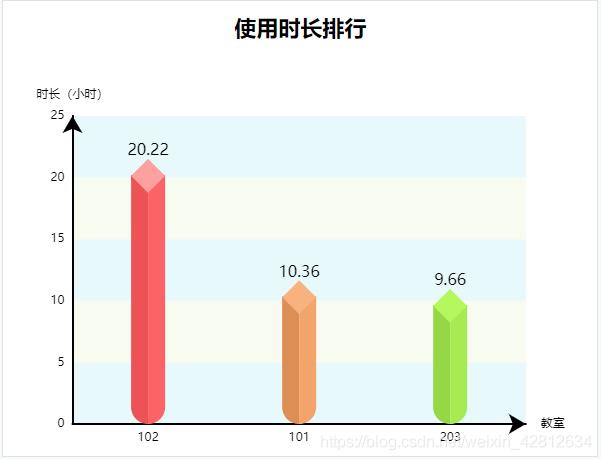
小怪兽,让我来保护你 人气:0先来看一下制作完成后的效果:
废话不多说,直接上代码:
HTML代码:
<div class="lineOne">
      <span class="spanTitle">使用时长排行</span>
     <div id="timeRange" style="width:100%;height:400px">
     </div>
</div>
JS部分:
timeRangeInit(xdata,ydata) {
      let nc = document.getElementById("timeRange");
      var myChart = echarts.init(nc);
      myChart.setOption({
        tooltip: {
          trigger: "axis"
        },
        grid: {
          top: "15%",
          left: "8%",
          right: "12%",
          bottom: "3%",
          containLabel: true
        },
        xAxis: {
          type: "category",
          data: xdata,
          name:'教室',
          splitLine: {
            show: false
          },
          axisTick: {
            show: false
          },
          axisLine: {
            symbol: ['none', 'arrow'],
            symbolSize: [15, 17],
            lineStyle: {
              color: '#000000',
              width: 2 //  改变坐标线的颜色
            }
          },
          axisLabel: {
            //调整x轴的lable
            textStyle: {
              fontSize: 12 ,// 让字体变大
            }
          }
        },
        yAxis: {
          type: "value",
          name:'时长(小时)',
          splitLine: {    //刻度线
            show: false,
          },
          splitArea:{     //柱状图后面的背景色
            show:true,
            areaStyle: {
              color: ["rgba(221,247,250,0.7)","rgba(245,249,232,0.7)"]
            }
          },
          axisTick: {
            show: false
          },
          axisLabel: {
            //调整y轴的lable
            textStyle: {
              fontSize: 12 // 让字体变大
            },
            show: true
          },
          axisLine: {
            symbol: ['none', 'arrow'],
            symbolSize: [15, 17],
            lineStyle: {
              color: '#000000',
              width: 2 //  改变坐标线的颜色
            }
          }
        },
        series: [
          {
            name: "时长统计",
            type: "bar",
            showSymbol: false,
            hoverAnimation: false,
            data: ydata,
            barWidth: 17, //柱图宽度
            itemStyle: {          //左面
              normal: {
                color:function(params) {
                  let colorList = ["#EA5353","#DB8D4D","#9DD530","#38CFCA","#6C54E2","#749f83","#ca8622","#bda29a","#6e7074","#546570"];
                  return colorList[params.dataIndex];
                },
                barBorderRadius:[0,0,0,180],
              }
            }
          },{
            name:'a',
            tooltip:{
               show:false
            },
            type: 'bar',
            barWidth:17,
            itemStyle:{       //右面
                normal:{
                  color:function(params) {
                    let colorList = ["#FA6363","#F1A363","#AEE93C","#41EBE5","#866FF5","#749f83","#ca8622","#bda29a","#6e7074","#546570"];
                    return colorList[params.dataIndex];
                  },
                  barBorderRadius:[0,0,180,0]
                }
            },
            data: ydata,
            barGap:0
        },{
            name:'b',
            tooltip:{
               show:false
            },
            type: 'pictorialBar',
            itemStyle: {        //顶部
                 normal: {
                  color:function(params) {
                    let colorList = ["#FC9F9F","#F7B177","#BBF64A","#4DF4EE","#947FFA","#749f83","#ca8622","#bda29a","#6e7074","#546570"];
                    return colorList[params.dataIndex];
                  },
                  borderColor:'',
                  borderWidth:0.01,
                  label: {
                        show: true, //开启显示
                        position: 'top', //在上方显示
                        textStyle: { //数值样式
                            color :'black',
                            fontSize: 16,
                            fontFamily:'微软雅黑',
                        }
                    }
                }
            },
            symbol: 'rect',
            symbolRotate:45,
            symbolSize: ['24','24'],
            symbolOffset:['0','-11'],
            symbolPosition: 'end',
            data: ydata,
            z:3
        }
        ]
      });
    },
加载全部内容