Vue highCharts数据可视化
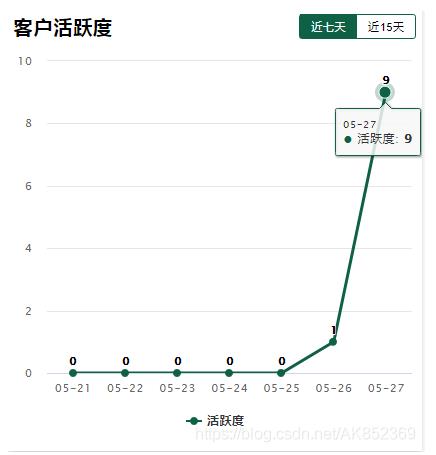
明知山_ 人气:0效果图
安装
npm install highcharts-vue
在main.js进行全局配置
import HighchartsVue from 'highcharts-vue'
Vue.use(HighchartsVue)
<highcharts :options="chartOptions"></highcharts>
<script>
export default {
  data() {
    return {
      chartOptions: {}
    };
  },
  mounted(){
  this.getChart()
  }
  methods:{
    getChart() {
      var template = {
        title: {
          //去掉标题
          text: ""
        },
        xAxis: {
          //自定义x轴
          categories:["05-21", "05-22", "05-23", "05-24", "05-25", "05-26", "05-27"]
        },
        yAxis: {
          //去掉y轴的value
          title: { text: "" }
        },
        credits: {
          //去掉水印
          enabled: false
        },
        plotOptions: {
          line: {
            //设置颜色,显示点
            color: "#0e6145",
            dataLabels: {
              enabled: true
            }
          }
        },
        series: [
          {
            name: "活跃度",
            data: [0, 0, 0, 0, 0, 1, 9]
          }
        ]
      };
      this.chartOptions = template;
    }
  }
 },
</script>
加载全部内容