Echarts图例显示百分比
Ciao_Traveler 人气:0echarts图例显示百分比
效果图
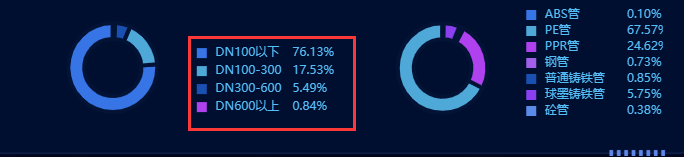
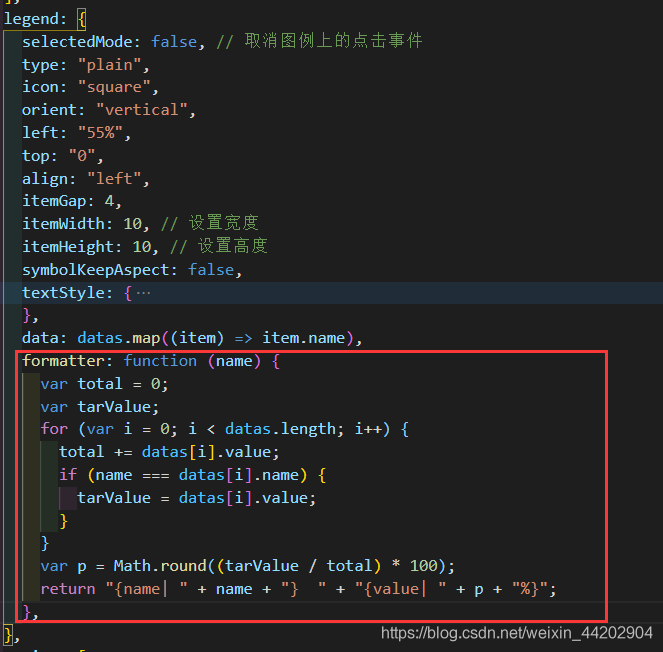
主要代码
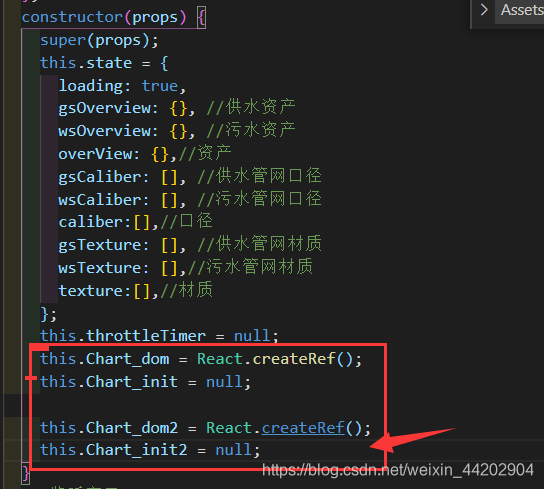
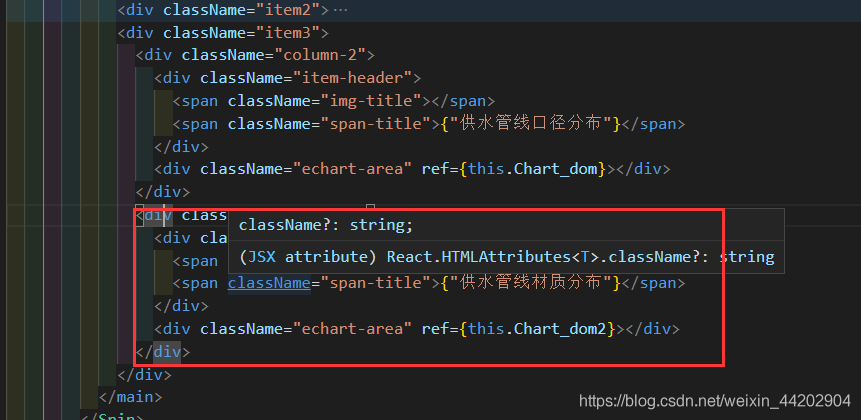
全部代码
secondChart = () => {
	//datas的数据是接口拿到的数据
    const { texture } = this.state;
    const datas = texture;
    var option = {
      color: [
        "#3774e5",
        "#4ea9d9",
        "#b041ef",
        "#a25fea",
        "#1b50b3",
        "#8a40ef",
        "#5a8be8",
      ],
      legend: {
        selectedMode: false, // 取消图例上的点击事件
        type: "plain",
        icon: "square",
        orient: "vertical",
        left: "55%",
        top: "0",
        align: "left",
        itemGap: 4,
        itemWidth: 10, // 设置宽度
        itemHeight: 10, // 设置高度
        symbolKeepAspect: false,
        textStyle: {
          rich: {
            name: {
              verticalAlign: "right",
              align: "left",
              width: 75,
              fontSize: 12,
            },
            value: {
              align: "left",
              width: 35,
              fontSize: 12,
            },
            count: {
              align: "left",
              width: 20,
              fontSize: 12,
            },
            upRate: {
              align: "left",
              fontSize: 12,
              color: "#54bef9",
            },
            downRate: {
              align: "left",
              fontSize: 12,
              color: "#54bef9",
            },
          },
          color: "#54bef9",
        },
        data: datas.map((item) => item.name),
        formatter: function (name) {
          var total = 0;
          var tarValue;
          for (var i = 0; i < datas.length; i++) {
            total += datas[i].value;
            if (name === datas[i].name) {
              tarValue = datas[i].value;
            }
          }
          var p = Math.round((tarValue / total) * 100);
          return "{name| " + name + "}  " + "{value| " + p + "%}";
        },
      },
      series: [
        {
          name: "数量",
          type: "pie",
          hoverAnimation: false,
          clockwise: false,
          radius: ["45%", "70%"],
          center: ["30%", "50%"],
          data: datas,
          itemStyle: {
            normal: {
              borderColor: "#021336",
              borderWidth: 4,
            },
          },
          label: {
            normal: {
              show: false,
              position: "center",
              formatter: "{text|{c}}\n{b}",
              rich: {
                text: {
                  align: "center",
                  verticalAlign: "middle",
                  padding: 8,
                  fontSize: 12,
                },
                value: {
                  align: "center",
                  verticalAlign: "middle",
                  fontSize: 12,
                },
              },
            },
            emphasis: {
              show: true,
              textStyle: {
                fontSize: "12",
              },
            },
          },
          labelLine: {
            normal: {
              show: true,
            },
          },
        },
      ],
    };
    this.Chart_init2 = echarts.init(this.Chart_dom2.current);
    this.Chart_init2.setOption(option);
  };
加载全部内容