python的annotate函数
watermelon12138 人气:0python的annotate函数
annotate函数
该函数的详细参数可调用内置属性__doc__查看。
	import matplotlib.pyplot as plt
    # plt.annotate(str, xy=data_point_position, xytext=annotate_position,
    #              va="center",  ha="center", xycoords="axes fraction",
    #              textcoords="axes fraction", bbox=annotate_box_type, arrowprops=arrow_style)
    # str是给数据点添加注释的内容,支持输入一个字符串
    # xy=是要添加注释的数据点的位置
    # xytext=是注释内容的位置
    # bbox=是注释框的风格和颜色深度,fc越小,注释框的颜色越深,支持输入一个字典
    # va="center",  ha="center"表示注释的坐标以注释框的正中心为准,而不是注释框的左下角(v代表垂直方向,h代表水平方向)
    # xycoords和textcoords可以指定数据点的坐标系和注释内容的坐标系,通常只需指定xycoords即可,textcoords默认和xycoords相同
    # arrowprops可以指定箭头的风格支持,输入一个字典
    # plt.annotate()的详细参数可用__doc__查看,如:print(plt.annotate.__doc__)
例1:
import matplotlib.pyplot as plt
fig = plt.figure(1, facecolor='white')
fig.clf()
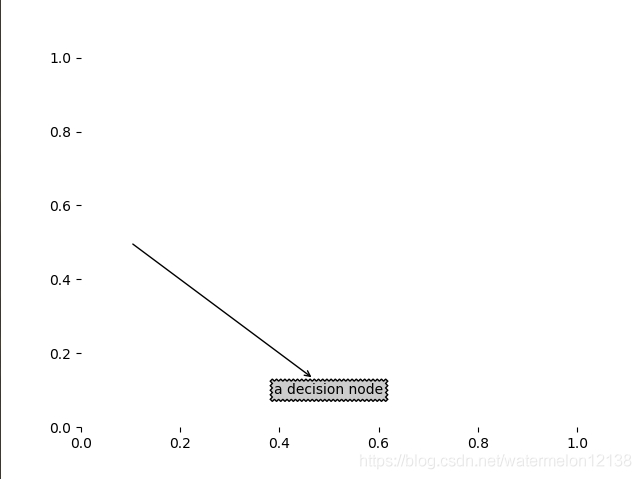
plt.annotate('a decision node', (0.1, 0.5), (0.5, 0.1), va="center", ha="center",
xycoords="axes fraction", textcoords="axes fraction",
bbox=dict(boxstyle="sawtooth", fc="0.8"), arrowprops=dict(arrowstyle="<-"))
plt.show()结果如下:
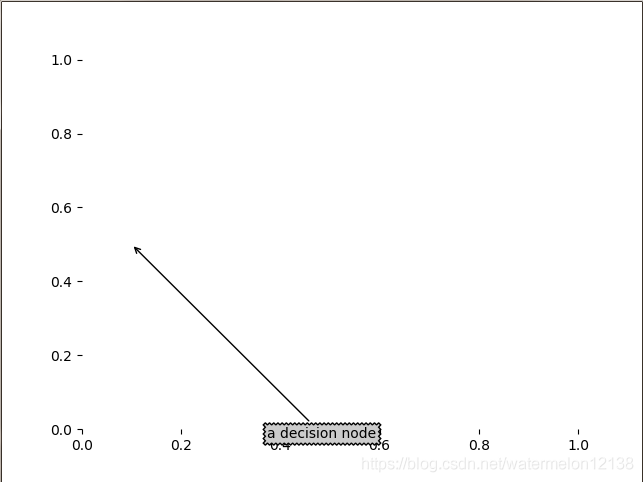
例2:给注释和数据点指定不同的坐标系
	import matplotlib.pyplot as plt
    fig = plt.figure(1, facecolor='white')
    fig.clf()
    # 这里指定数据点的坐标系原点在xy轴的左下角,而注释的坐标系原点在这个图像(figure)的左下角
    # 所以才会出现注释内容下移覆盖了x轴
    plt.annotate('a decision node', (0.1, 0.5), (0.5, 0.1), va="center",  ha="center",
                 xycoords="axes fraction", textcoords="figure fraction",
                 bbox=dict(boxstyle="sawtooth", fc="0.8"), arrowprops=dict(arrowstyle="<-"))
    plt.show()
结果如下:
可视化annotate()函数解析
函数功能:添加图形内容细节的指向型注释文本。
调用签名:
plt.annotate(string, xy=(np.pi/2, 1.0), xytext=((np.pi/2)+0.15, 1,5), weight="bold", color="b", arrowprops=dict(arrowstyle="->", connectionstyle="arc3", color="b"))
string:图形内容的注释文本xy:被注释图形内容的位置坐标xytext:注释文本的位置坐标weight:注释文本的字体粗细风格color:注释文本的字体颜色arrowprops:指示被注释内容的箭头的属性字典
代码实现:
import matplotlib.pyplot as plt
import numpy as np
x = np.linspace(0.05, 10, 1000)
y = np.sin(x)
plt.plot(x, y, ls="-.", lw=2, c="c", label="plot figure")
plt.legend()
plt.annotate("maximum", xy=(np.pi/2, 1.0), xytext=((np.pi/2)+1.0, .8),
             weight="bold", color="b",
             arrowprops=dict(arrowstyle="->", connectionstyle="arc3", color="b"))
plt.show()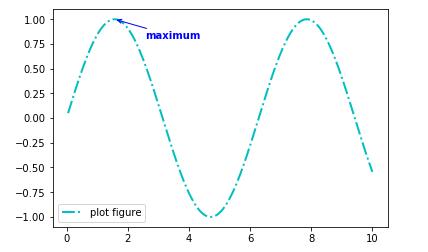
以上为个人经验,希望能给大家一个参考,也希望大家多多支持。
加载全部内容