Pandas中describe()函数的具体使用
林几瑕 人气:0先附上官方文档:
http://pandas.pydata.org/pandas-docs/stable/reference/api/pandas.DataFrame.describe.html
describe()有三个参数:
DataFrame.describe(percentiles=None, include=None, exclude=None)
# return:Series or DataFrame.   Summary statistics of the Series or Dataframe provided.
几个要点:
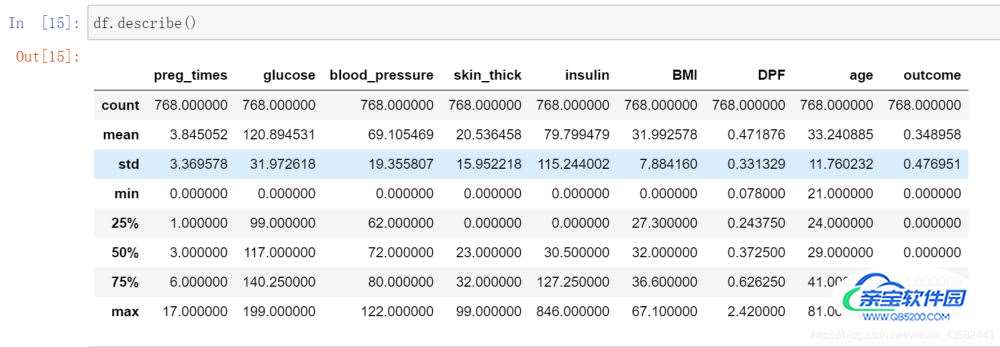
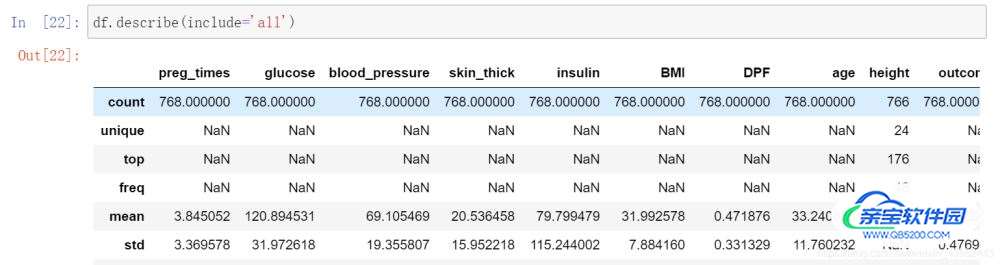
1.include=‘all’,代表对所有列进行统计,如果不加这个参数,则只对数值列进行统计
datafile.describe(include='all')
没加参数的少了height列(height为离散型变量,其余为数值型):
加了参数include=‘all’,出现height变量:
2.统计变量说明:
- count:数量统计,此列共有多少有效值
- unipue:不同的值有多少个
- std:标准差
- min:最小值
- 25%:四分之一分位数
- 50%:二分之一分位数
- 75%:四分之三分位数
- max:最大值
- mean:均值
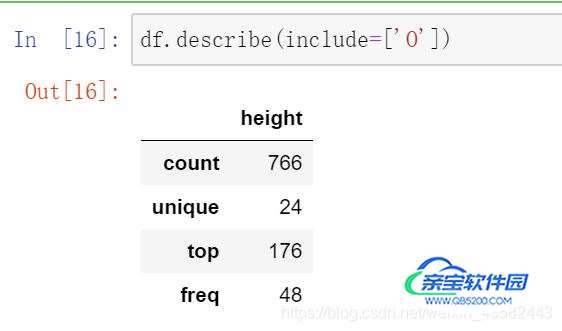
3.仅仅显示离散型变量:include=[‘O’]
df.describe(include=['O'])
只显示了height列:
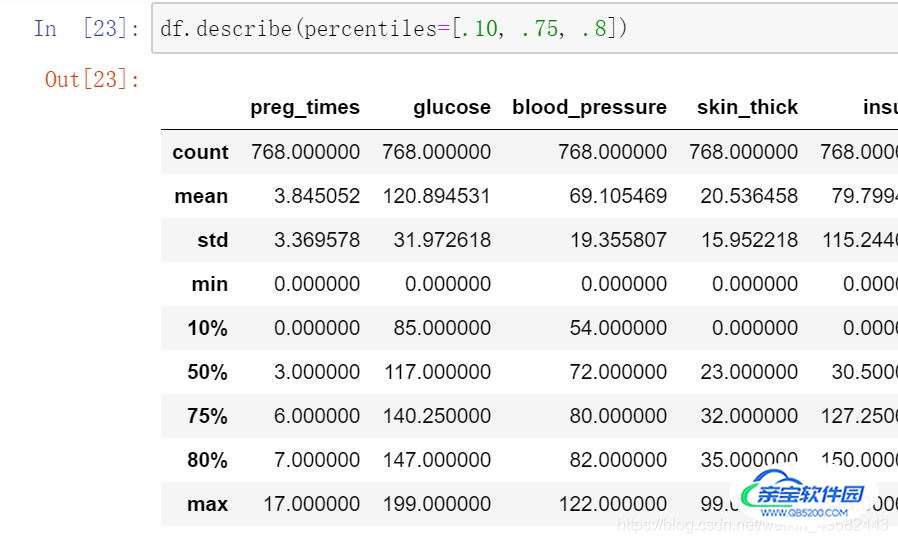
4.第一个percentiles,这个参数可以设定数值型特征的统计量,默认[.25, .5, .75],返回25%,50%,75%时候的数据,可修改参数,**如:
df.describe(percentiles=[.10, .75, .8])
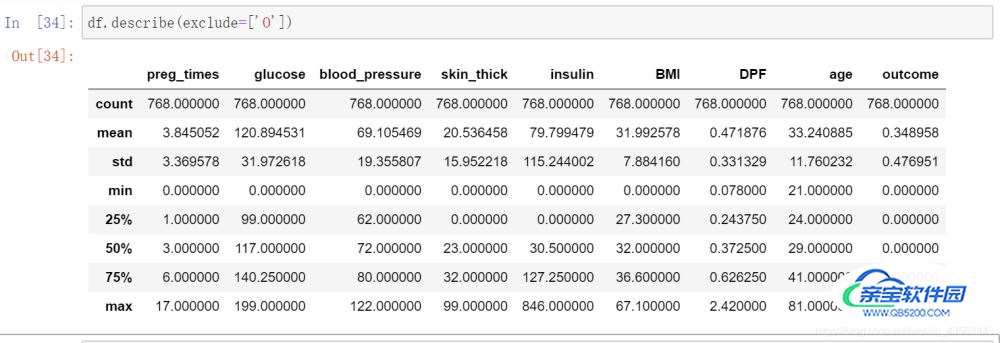
5.第三个参数可以指定不选择哪些列。
例如
df.describe(exclude=['O'])
height列没有了:
加载全部内容