jQuery插件FusionCharts实现的2D饼状图效果【附demo源码下载】
翱翔天地 人气:0本文实例讲述了jQuery插件FusionCharts实现的2D饼状图效果。分享给大家供大家参考,具体如下:
1、实现源码:
<!DOCTYPE html>
<html>
  <head>
    <meta charset="UTF-8">
    <title>FusionCharts2D饼图</title>
    <script src="js/jquery-1.4.2.min.js"></script>
    <script type="text/javascript" src="js/fusioncharts.js" ></script>
    <style>
      body,html{
        width: 99%;
        height: 98%;
        font-family: "微软雅黑";
        font-size: 12px;
      }
    </style>
    <script>
      $(document).ready(function(){
        FusionCharts.ready(function () {
          var ageGroupChart = new FusionCharts({
            type: 'pie2d',
            renderAt: 'pie2D',
            width: '1350',
            height: '650',
            dataFormat: 'json',
            dataSource: {
              "chart": {
                "caption": "统计2016年每个季度的收入比例",
                "subCaption": "",
                "paletteColors": "#0075c2,#1aaf5d,#f2c500,#f45b00,#8e0000",
                "bgColor": "#ffffff",
                "showBorder": "0",
                "use3DLighting": "0",
                "showShadow": "0",
                "enableSmartLabels": "0",
                "startingAngle": "0",
                "showPercentValues": "1",
                "showPercentInTooltip": "0",
                "decimals": "2",
                "captionFontSize": "14",
                "subcaptionFontSize": "14",
                "subcaptionFontBold": "0",
                "toolTipColor": "#ffffff",
                "toolTipBorderThickness": "0",
                "toolTipBgColor": "#000000",
                "toolTipBgAlpha": "80",
                "toolTipBorderRadius": "2",
                "toolTipPadding": "5",
                "showHoverEffect":"1",
                "showLegend": "1",
                "legendBgColor": "#ffffff",
                "legendBorderAlpha": '0',
                "legendShadow": '0',
                "legendItemFontSize": '10',
                "legendItemFontColor": '#666666'
              },
              "data": [
                {
                  "label": "第一季度",
                  "value": "255040"
                },
                {
                  "label": "第二季度",
                  "value": "689545"
                },
                {
                  "label": "第三季度",
                  "value": "784595"
                },
                {
                  "label": "第四季度",
                  "value": "325848"
                }
              ]
            }
          }).render();
        });
      });
    </script>
  </head>
  <body>
    <div id="pie2D"></div>
  </body>
</html>
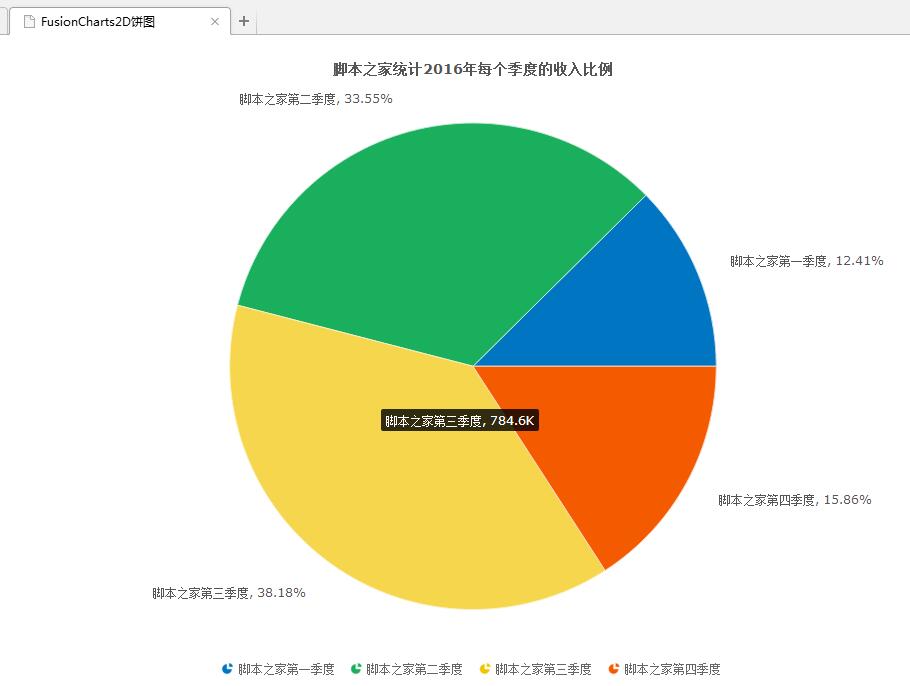
2、实现效果图:
附:完整实例代码点击此处本站下载。
希望本文所述对大家jQuery程序设计有所帮助。
加载全部内容