R语言绘图Ridgeline plot山脊图
黄小仙 人气:0今天给大家介绍一下Ridgeline plot(山脊图)的画法。
作图数据如下:
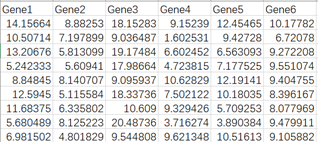
Step1. 绘图数据的准备
首先要把你想要绘图的数据调整成R语言可以识别的格式,建议大家在excel中保存成csv格式。
Step2. 绘图数据的读取
data<-read.csv(“your file path”, header = T)
#注释:header=T表示数据中的第一行是列名,如果没有列名就用header=F
Step3. 绘图所需package的安装、调用
library(reshape2)
library(ggplot2)
library(ggridges)
# 注释:package使用之前需要调用
# 今天要用到geom_density_ridges()函数需要调用ggridges包
# 直接用install.packages(ggridges)可以安装
Step4. 绘图
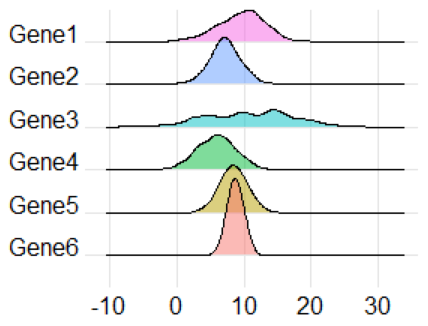
ggplot(data_melt, aes(x = value , y = variable , fill = variable)) +
 geom_density_ridges() +
 theme_ridges() +
 theme(legend.position = "none")
调整透明度
ggplot(data_melt, aes(x = value , y = variable , fill = variable)) +
 geom_density_ridges(alpha = 0.5) +
 theme_ridges() +
theme(legend.position = "none")

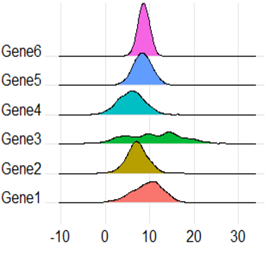
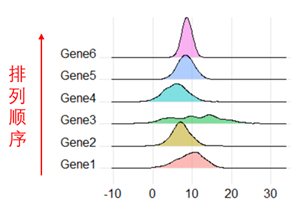
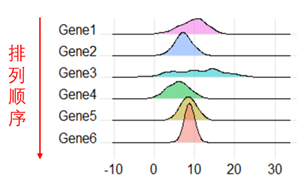
更改顺序
level<-levels(data_melt$variable)
data_melt$variable<-factor(data_melt$variable, levels = rev(level))
ggplot(data_melt, aes(x = value , y = variable , fill = variable)) +
 geom_density_ridges(alpha = 0.5) +
 theme_ridges() +
 theme(legend.position = "none")

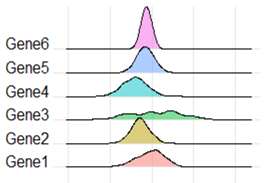
更改线条形状
ggplot(data_melt, aes(x = value , y = variable , fill = variable)) +
 geom_density_ridges(alpha = 0.5, stat="binline", bins=20) +
 theme_ridges() +
 theme(legend.position = "none")


加载全部内容