vue Echarts图表宽度没占满
未来可期xm 人气:0vue Echarts图表宽度没占满
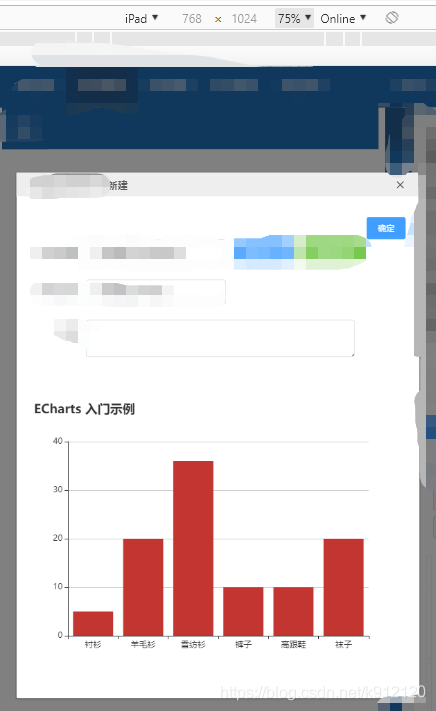
显示效果:

经过测试,当把宽度写成固定px的时候,就能正确渲染。
解决方法
1、宽高写成固定px,针对宽度不需要自适应的大屏。
2、当宽度需要自适应,父元素需要设置宽高,可以使用$nextTick 当元素宽度发生改变,只需要等待DOM渲染完成在渲染图表,这样就不会出现问题了。
相似案例:
当点击按钮使用v-if进行图表切换,同样会使出现宽高不占满情况。
mounted() {
	this.$nextTick( () => {
	  this.drawBar();
	})
}
vue Echarts图表宽度自适应,亲测有效
实现宽度自适应语句
//实现自适应部分
 window.onresize = () => {
     // 基于准备好的dom,初始化echarts实例
    let myChart = this.$echarts.init(document.getElementById('newEcharts'));
    myChart.resize();
};
代码使用如下:
<template>
  <el-row>
     <el-col :xs="24" :sm="24" :md="24" :lg="24">
       <div id="newEcharts" style="width:100%;height:400px;padding-top:40px"></div>
     </el-col>
  </el-row>
</template>
<script>
   export default {
    data() {
      return {
        newVisible: false,
        newDialogFormVisible: false,

      };
    },
    mounted () {
      this.initEcharts()
      //实现自适应部分
      window.onresize = () => {
      // 基于准备好的dom,初始化echarts实例
        let myChart = this.$echarts.init(document.getElementById('newEcharts'));
        myChart.resize();
        };
    },
    methods: {
      // 创建方法
      initEcharts() {
        var echarts = require('echarts');

        // 基于准备好的dom,初始化echarts实例
        const myChart = this.$echarts.init(document.getElementById('newEcharts'));
        // 绘制图表
         const option = {
            title: {
                text: 'ECharts 入门示例'
            },
            tooltip: {},
            xAxis: {
                data: ['衬衫', '羊毛衫', '雪纺衫', '裤子', '高跟鞋', '袜子']
            },
            yAxis: {},
            series: [{
                name: '销量',
                type: 'bar',
                data: [5, 20, 36, 10, 10, 20]
            }]
        };
        myChart.setOption(option)
      },
    },
  }
</script>
效果如下:
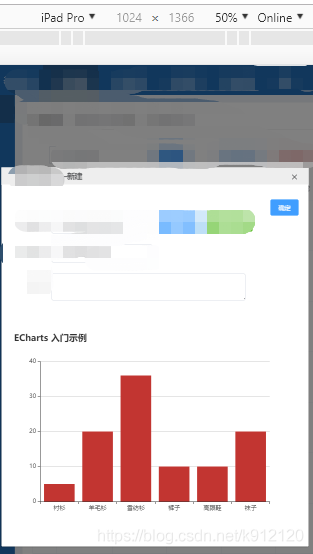
以上为个人经验,希望能给大家一个参考,也希望大家多多支持。
加载全部内容